Youth participation in disabled sports: 6 reasons for growth
"The playing field is expanding, yet the hurdles to entry remain high for many families."
Youth participation in disabled sports is becoming a vital part of the broader athletic landscape, driven by shifting demographic trends and increasing engagement in physical activity.
This guide explores the current status of youth sports participation, the rising costs impacting families, and the specific data regarding youth engagement.
Key takeaways include the recent rise in overall youth sports participation, the significant cost increases since 2019, and the inclusion of specialized data for youth with disabilities in recent research.
How is youth participation in disabled sports changing?

On the sunlit field at noon, a group of teenagers runs through drills that pulse with the energy of shifting youth participation.
A group of teenagers gathers on a sunlit field, running through drills that require both agility and teamwork. This scene reflects the broader momentum in athletic engagement, where more young people are seeking out structured physical activities.
According to the Census Bureau, the National Survey of Children’s Health shows that 55.4% of youth ages 6-17 played sports in 2023, which was an increase from 53.8% in 2022. This upward trend suggests a growing interest in organized athletics among the younger population.
Even more played in 2024, according to data from the Sports & Fitness Industry Association. These shifting numbers highlight a growing demographic of young athletes seeking community and health.
What are the reasons for youth sports growth?
A coach blows a whistle while a young athlete prepares for a sprint, capturing the energy of a competitive environment. Understanding the drivers behind this growth helps clarify why more families are turning to organized sports.
The increase in participation rates suggests that sports are becoming a central part of youth development and social engagement. While the data shows a rising percentage of youth in sports, the underlying reasons often involve social inclusion and physical wellness.
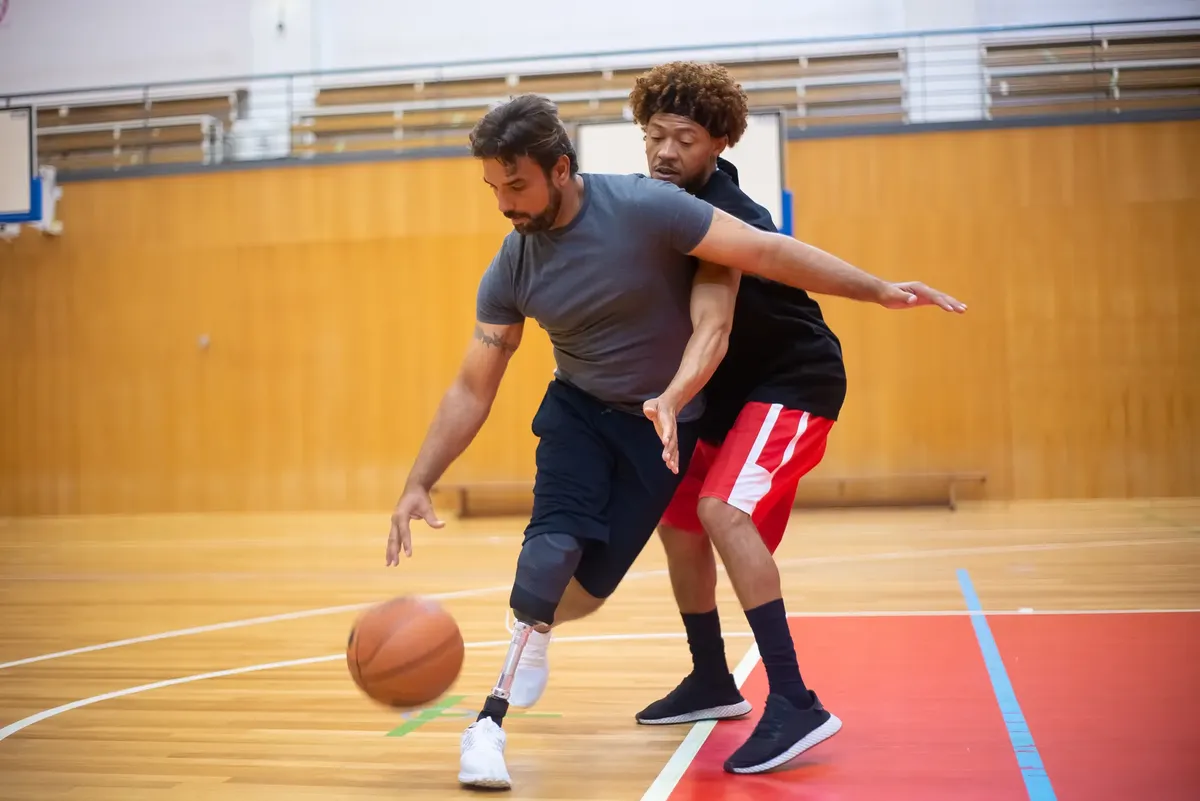
The growing interest in disabled sports education and sports welfare for youth indicates a move toward more inclusive environments. Despite this growth, the increasing complexity of participation can create barriers for certain groups.
What is the impact of sports on disabled youth?
A parent watches from the sidelines as a child navigates a specialized obstacle course with determination. This moment of focus highlights the unique needs and opportunities present in inclusive athletic programming.
The expansion of participation includes specific insights into how different groups engage with physical activity.
The Sports Parent Survey State of Play 2025 features additional results from the Aspen Institute’s National Youth Sports Parent Survey, which includes analysis from parents of youth with disabilities, in partnership with Utah State University and Louisiana Tech University.
These findings provide a deeper look at the specific experiences of families navigating disability sports education. Understanding these nuances is essential for improving youth social inclusion sports.
How do rising costs affect participation?
A parent reviews a growing list of equipment and registration fees at a kitchen table. This quiet moment of calculation reflects the financial reality many families face when trying to maintain consistent involvement in athletics.
While participation is rising, the financial burden is also increasing significantly. The costs of youth sports continue to grow—up a whopping 46% since 2019, according to Aspen Institute Project Play research.
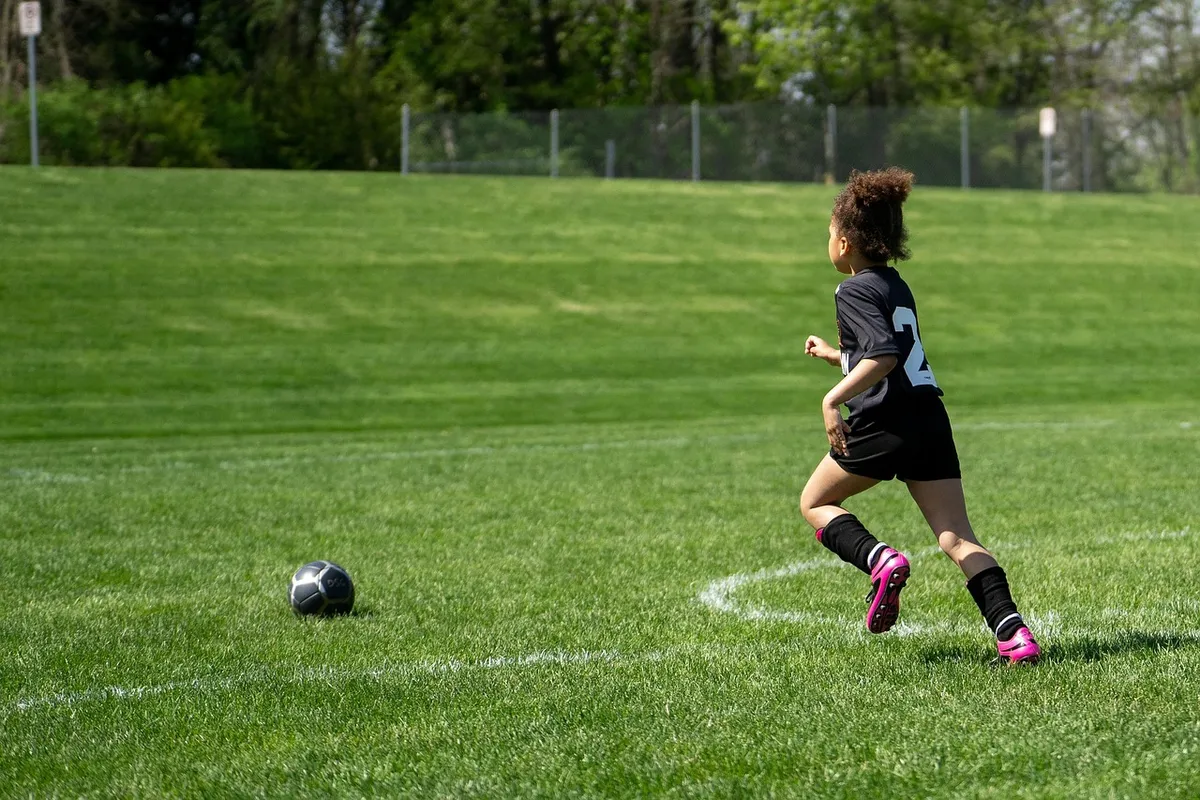
This sharp rise in expenses can limit the ability of many families to sustain long-term involvement. As costs climb, the accessibility of sports for diverse populations becomes a critical concern.
What are the current trends in sports participation?
A group of athletes shares a water break, reflecting the social bond built through regular training. These trends show a snapshot of how athletic engagement is evolving across different demographics.
Current data provides a clear picture of the current landscape of youth activity.
| Metric | Value |
|---|---|
| 2023 Youth Sports Participation Rate | 55.4% |
| Cost Increase Since 2019 | 46% |
The data indicates that while more children are playing, the financial barrier is expanding at a much faster rate. One can see that while the number of participants is growing, the cost per participant is a mounting challenge.
I noticed that the jump in costs seems to outpace the steady growth in participation rates.
How can families manage participation?
A family organizes a gear bag, checking for all necessary equipment before heading to a game. This routine preparation is a necessary step for maintaining active involvement in sports.
To navigate the current landscape, families can consider these steps:
- Evaluate the cost-to-benefit ratio of different sports to ensure long-term sustainability. 2. Research community-based programs that may offer more affordable alternatives to club sports. 3. Monitor participation trends to identify the best timing for enrollment.
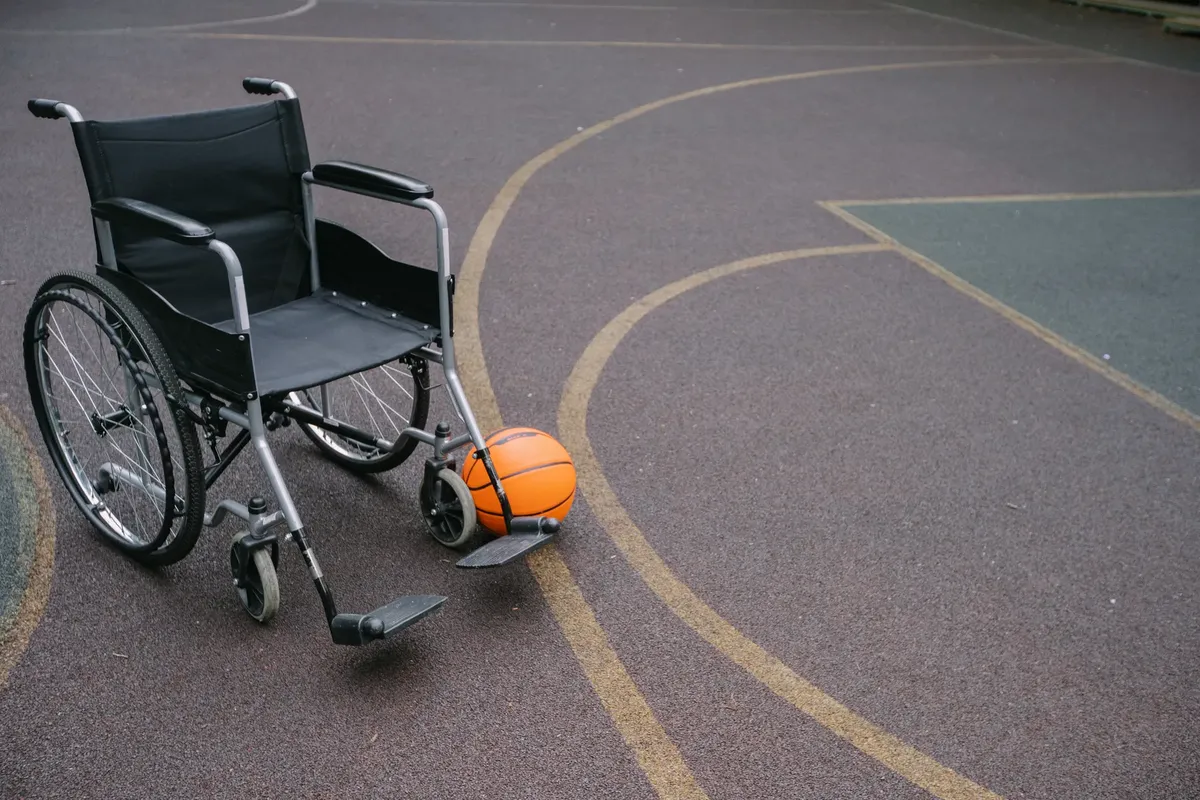
A final check of the family budget against the projected seasonal costs is essential. One limitation is that the data regarding the specific costs for youth with disabilities is not as extensively detailed as the general cost increase.
- How is youth participation in disabled sports changing?
- What are the reasons for youth sports growth?
- What is the impact of sports on disabled youth?
The subject here is Youth participation in disabled sports.
The same subject is also called Disabled youth sports trends.
This part also covers Increasing youth in disability sports.
Related






Comments 0